Web app / 2021
Investment Estimator
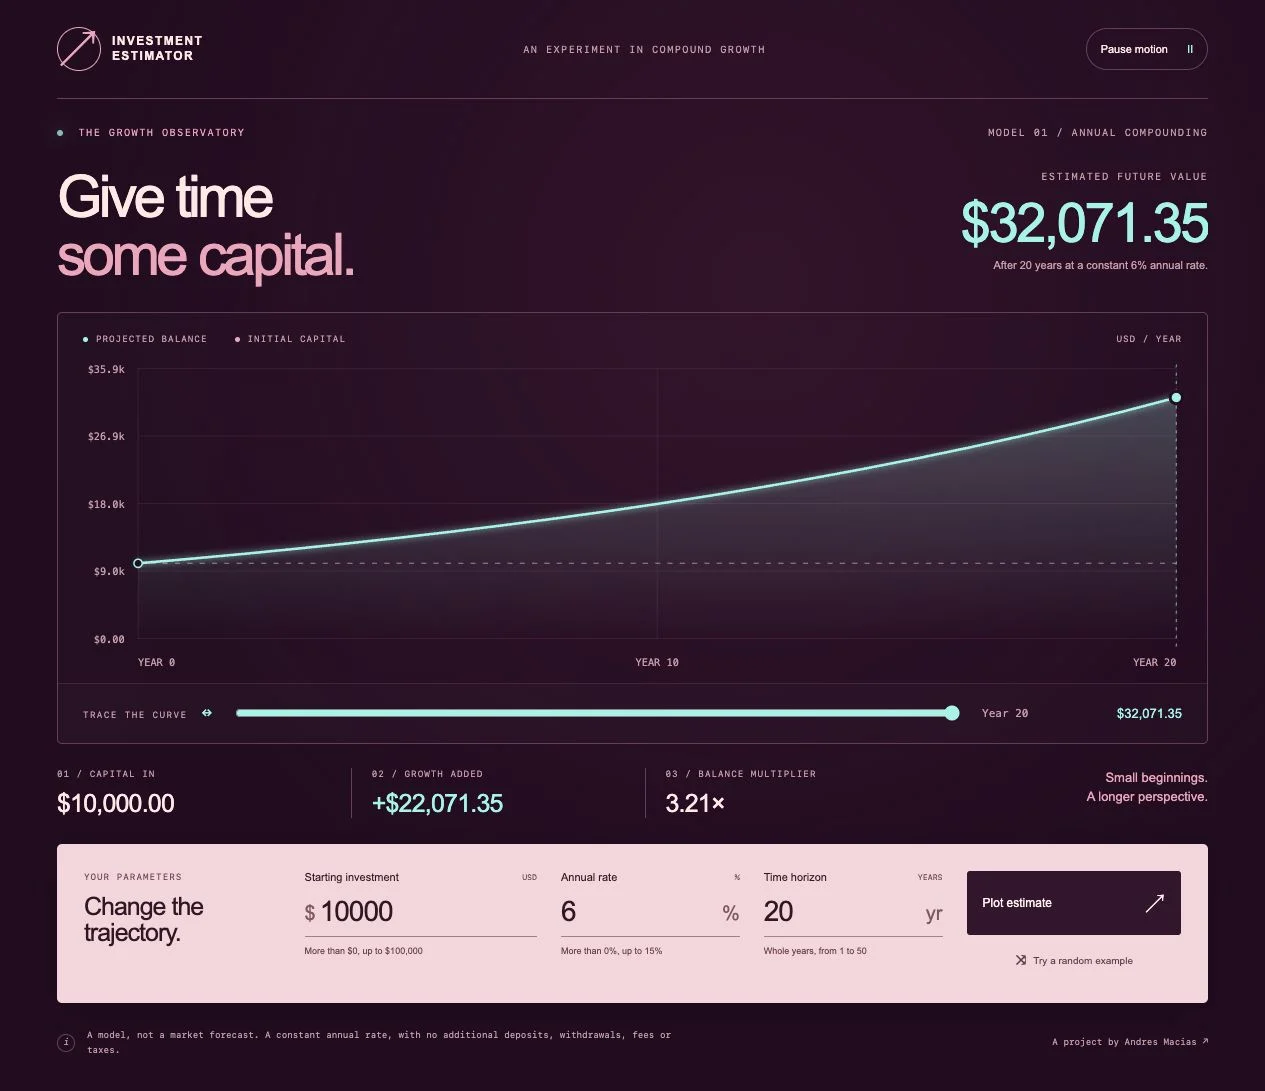
A graph-led investment observatory with an interactive yearly balance trace and randomized examples.
The project
A JavaScript exercise that estimates annual compound growth from an initial amount, rate, and number of years. A second action generates random inputs so the calculation can be explored quickly.
The implementation
The app validates its numeric fields before calculating a result. Native JavaScript drives the form, summary and SVG graph from the same annual-compounding model. A keyboard-operable slider exposes the balance at each year, with a numeric readout and accessible description. The graph starts from zero and labels values in dollars and years.
I worked with AI to build the burgundy, rose and cyan observatory layout. A wide graph and horizontal parameter dock give it a different structure from the other calculators. Native motion can be paused, and reduced-motion preferences are respected.
Scope and limitations
This is an educational calculator with a constant-rate model. It validates numeric inputs and whole-year terms, clears stale results after invalid entries, and formats small and large amounts consistently. It is not a financial planning product.
Deployment
The calculator runs entirely in the browser and is served through GitHub Pages.
FROM THE LIVE DEMO
A closer look.
Open a screenshot to see it at full size.