Web app / 2026
City Atlas
An interactive D3 map exploring a historical sample of 50 U.S. cities.
The project
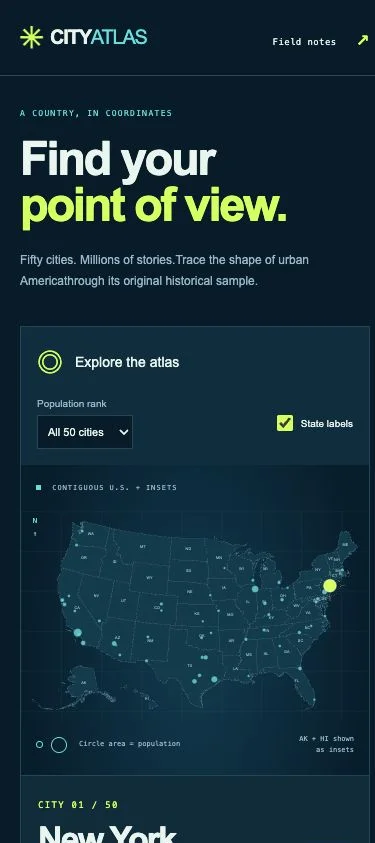
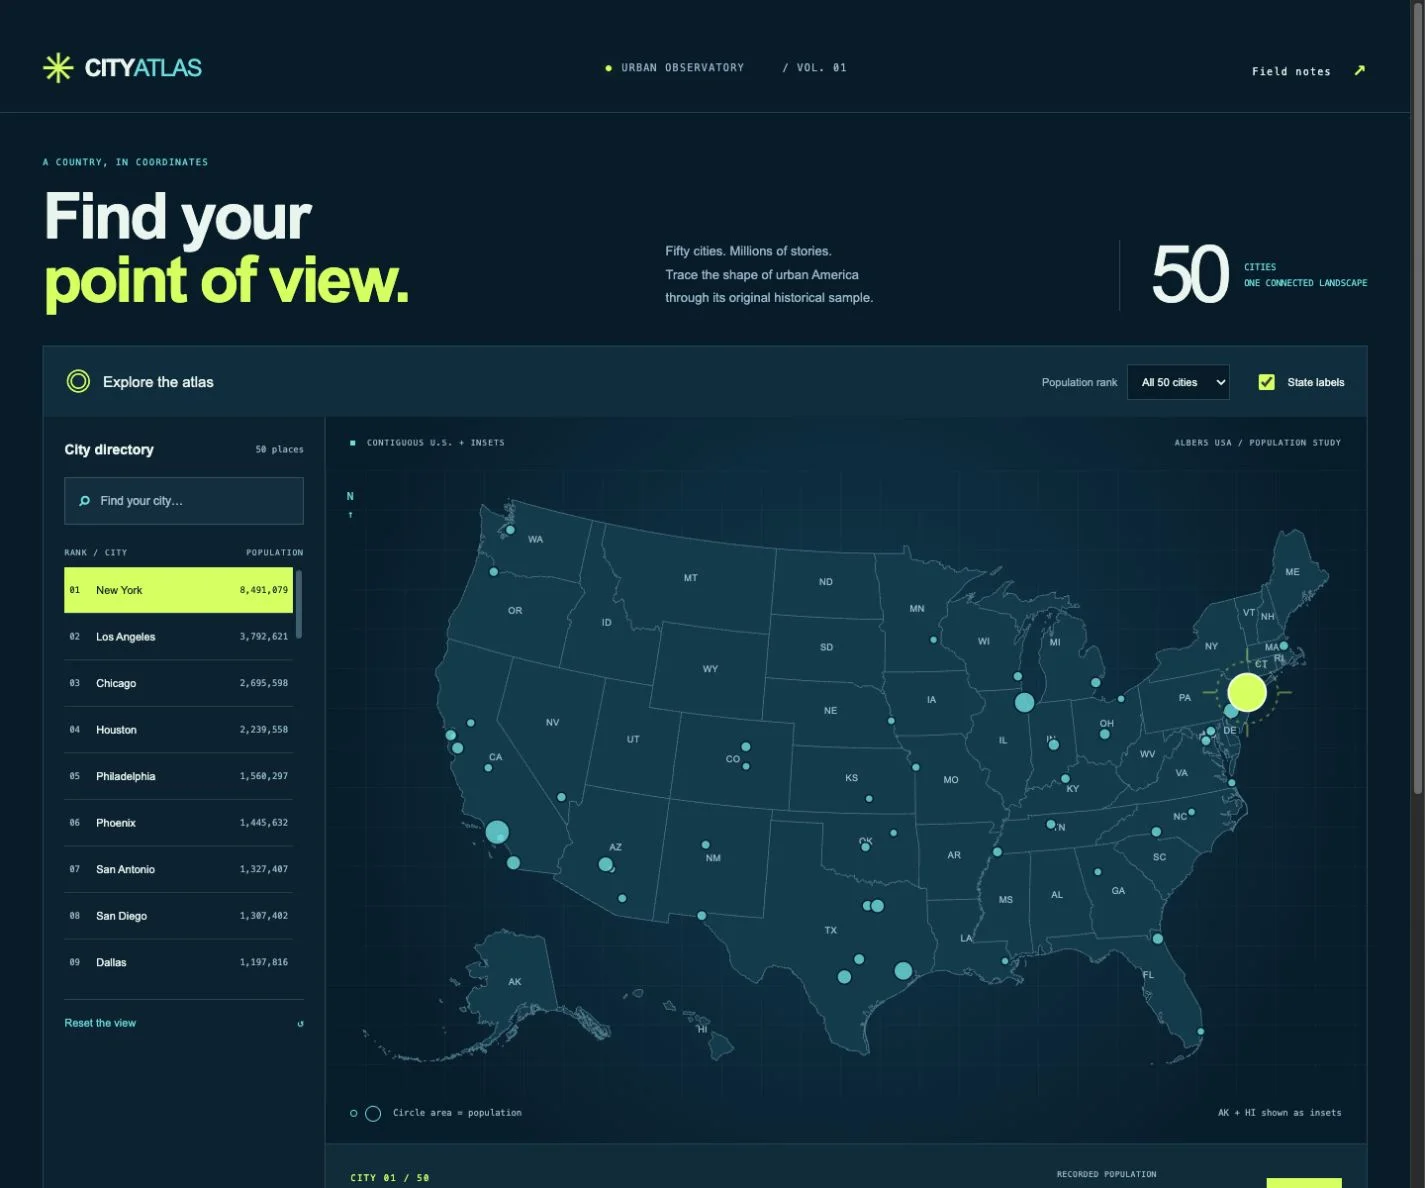
City Atlas recovers the D3 mapping exercise from my Emerging-tech coursework. A midnight-blue urban observatory puts a cyan map, chartreuse city selection and searchable directory into a single cartographic workspace. A selection reticle adds a focused visual response as you explore; the mobile layout places the map above the directory.
Explore 50 cities, filter the top 10 or 25, toggle state labels, step through the selection or download the CSV. Marker area remains proportional to population.
How it works
D3 projects the state boundaries and city coordinates into an accessible SVG map. Search and ranking filters work together, with keyboard-selectable markers and clear empty results. Code and data are bundled locally, so the demo needs no map API, key or subscription.
The city values are the original historical example dataset, with no consistent census year declared. They are not current population figures. The published state boundaries use attributed U.S. Census data distributed by the openly licensed us-atlas project.
Built together
I worked with ChatGPT/Codex to redesign and modernize the original exercise while preserving its data and proportional-marker behavior. Tests cover all 50 records, filtering, projection and marker sizing; browser checks cover interaction and narrow screens. GitHub Actions publishes the verified build to GitHub Pages.
FROM THE LIVE DEMO
A closer look.
Open a screenshot to see it at full size.